
COPKIT is developing data-driven policing technologies to support Law Enforcement Agencies (LEAs) in preventing, investigating, and mitigating crime and terrorism. In this blog, IBM Ireland’s Innovation Exchange and Thales Nederland provide an overview of COPKIT’s tools for the analysis of spatial-temporal phenomena, encompassing modelling, forecasting and anomaly detection.
Understanding the spatial and temporal patterns of criminal activities is of crucial importance for combatting crime. The increased usage of new information and communication technologies may seem to have diminished the importance of the spatial localisation. However, criminals still traffic physical goods such as firearms and are embedded in a social context and LEAs are still facing physical criminals to arrest, keeping the spatial dimension relevant. The COPKIT project has therefore developed tools for the analysis of spatial-temporal data, such as the distribution of crime occurrence, with the goal of modelling the distribution, forecasting, and detecting anomalies. For this purpose, a combination of expert knowledge and Machine Learning techniques based on historical datasets is used. This blog outlines the problems that LEAs face, the goals of the work of COPKIT, the tools developed to achieve these goals, and finally how these tools were put into practice.
The challenges of analysing spatial-temporal patterns of criminal activities
Law Enforcement Agencies have several purposes when analysing the spatial-temporal distribution of crime:
- Improve their understanding of criminal activities with the objective of adapting their policies. This includes short term goals, for instance adapting the resources of the police to crime activities but also in the longer term, understanding the favourable factors and drivers to support policymakers in their decisions
- Discover new or unusual criminal activities, or unusual levels thereof for strategic and investigative actions
- Provide knowledge and context that can support the understanding and interpretation of intelligence during on-going investigative activities
For the above-mentioned purposes, a number of capabilities are required. The first one is the ability to model the crime distributions, for example, to provide expected values for the crime rate, given the current available knowledge. The “expected” values can be for time in the past (modelling) or for the future, leading to the capability of forecasting, which is critical for resource management. Finally, the capability of detecting regions and times in which the observed criminal activity is “abnormal” allows LEA analysts to focus their attention on specific cases.
It should be noted that explainability and transparency of the modelling (and forecasting) is critical to ensure that LEAs conduct their work within an adequate ethical framework. There is a well-documented issue in many underprivileged areas of both under and over policing, which can lead to significant biases in the reporting of crimes. Habitants of areas with low trust in the police may choose not to report a crime and in some areas, having a large police presence may result in an increase in the number of minor crimes reported that may be otherwise unnoticed in areas with a less active police presence. These data biases are a significant ethical concern for predictive technologies. It’s essential for such biases to be identified and for the reasoning behind a forecast to be explained to LEA analysts so that they can justify their decisions based on it and independently confirm the logic.
Addressing challenges with the COPKIT approaches
Spatial temporal phenomena pose challenges for analysts, in particular because of the need to mentally apprehend both spatial and temporal dimensions simultaneously. Recognising and interpreting trends becomes more difficult even when using modern visualisations (3D slicing or movies). Additionally, the volume of data can make it costly for analysts to know where (and when) to direct their attention. In many cases, relying on human skills for interpretation and anomaly detection will involve significant specialised resources and automation will help LEAs make efficient use of their resources.
Furthermore, visual analytics can provide qualitative insights, but they are less suitable to provide quantitative insights. AI and machine learning tools can help with the quantification. However, the statistical properties of spatial-temporal data call for the development of dedicated tools and techniques.
In the COPKIT project, two main approaches to the challenge of spatial-temporal modelling and forecasting were used simultaneously. The first one is largely data driven, a big data approach, linking spatial-temporal event data with contextual data sources. The second one uses an explicit modelling of interaction between drivers of crime activities, inter-regional influences and criminal activities and can be used on low data scenarios directly embedding expert knowledge into the models.
These different approaches were chosen given the variety of data and expert resources available to different LEAs in different types of crime. With some event types, such as assaults involving the use of firearms, there is a high quantity of granular data collected. In other instances, data is sparser, such as in incidents of firearms trafficking. These differences in volume of events require different machine learning approaches.
Regarding anomaly detection, the approach proposed makes use of the definition of anomaly as “values that are significantly different from the expectations”. Commonly, the “expected values” (the baseline) in a certain spatial-temporal region are computed based on the assumption that they should be somewhat similar to the observed values (in the vicinity). An anomalous region or set of is then a region in which the values differ significantly from the other regions over a certain period of time. However, crime statistics are often significantly influenced or driven by known factors (for instance socio-economic or geographical factors) that are themselves not homogeneously distributed over regions and time.
The COPKIT approach leverages the work on modelling spatial temporal phenomena: the baseline of expected value is computed by the models. In this way, it incorporates the influence of factors already taken into account in the modelling and is able to provide more relevant anomalies. Note that the approach can also be used to detect consistent biases in the models by detecting regions in which the crime numbers are consistently over- or under-estimated. The iterative use of a modelling tool and an anomaly detection tool leads to a virtuous circle in which an analyst iterates between analysis of the underlying causes of anomalies and model improvement.
The anomaly detection approach can, in fact, also be used as an auditing tool for the crime rate modelling tools.
IBM ESTF, an approach based on Deep Neural Networks
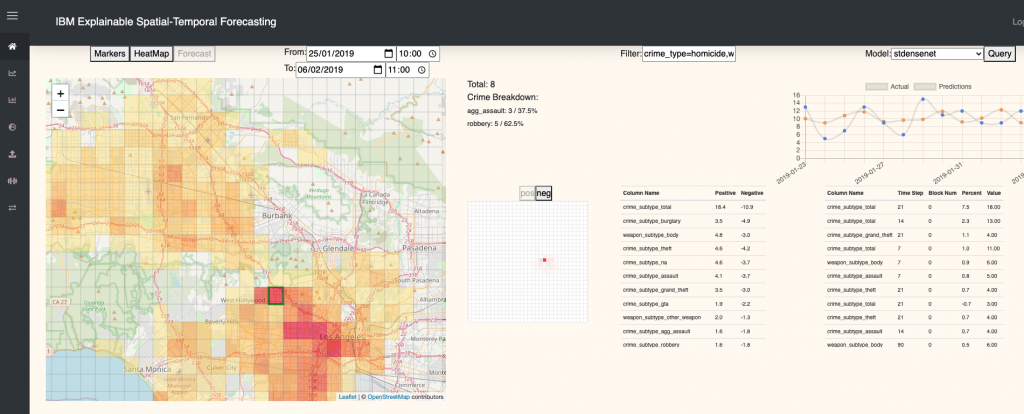
Screenshot of the ESTF displaying crime forecasts for an area in Los Angeles along with the explanation value to the right.
The Tool guides LEAs through the process of uploading their data, configuring, training, and evaluating models using a number of different model architectures, allowing LEAs to choose the configuration that best suits their data, then finally displaying forecasts based on these models.
The Component also creates a “forecast explanation” display, which indicates to an LEA user what the model is looking at, what areas are most important for increasing or decreasing the forecast or what contextual factors affect the forecast the most. Using these indicators, the LEA can make a judgement call on how much to trust the given forecast as well as providing insights into the possible causal factors of an increase in crime.
Thales CASTF, an approach using explicit statistical dependencies between crime drivers and criminal activities
The second approach to spatial-temporal modelling is based on a class of statistical models (Conditional Auto-Regressive Hierarchical Bayesian Models) chosen because they allow to model separately different sorts of influences, such as crime drivers and facilitators, and spatial effects, such as the influence of one region over neighbouring regions (i.e., “spill-over” of criminality). The qualitative knowledge of the LEA analysts (influential factors, geographical features that influence criminal behaviour) are incorporated in the model. The parameters learned are interpretable in terms of real-world influence, providing a high level of explainability of the expected and forecasted values.
The anomaly detection tool is based on the “scan statistics” approach. Candidate “blocks” of values (values of neighbouring regions over a certain period of time) are tested against the expected values to detect anomalies. The tool offers controls to the user, with respect to the duration and spatial size of the potential anomaly. With user controls, different shapes of anomalies can be detected, for instance elongated anomalies aligned with geographical features (borders, physical boundaries such as rivers etc.). The user can prioritise the obtained list of anomalies depending on the magnitude or on statistical significance. Once an anomaly is discovered, the analyst can examine it in detail to determine if it is generated by a bias in the model or if it is a real trace of anomalous criminal activity, such as the presence of an organised crime group.
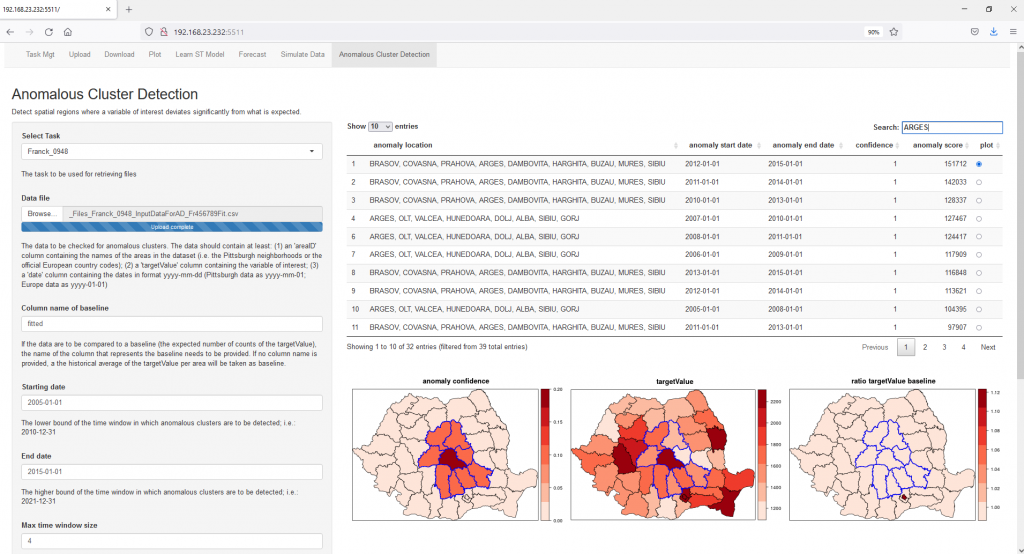
A screenshot of the list of anomalies detected by the CASTF tool on Romania crime data, used as an exercise.
Case Study – Latvian Crime
The Latvian State Police, partner in COPKIT provided a dataset of criminal activities to the consortium. The datasets provide monthly occurrences of crime for different type of crimes in the LAU2 regions over the 2013-2019 period. While the time series is relatively short (given the seasonality effects), encouraging results were produced.
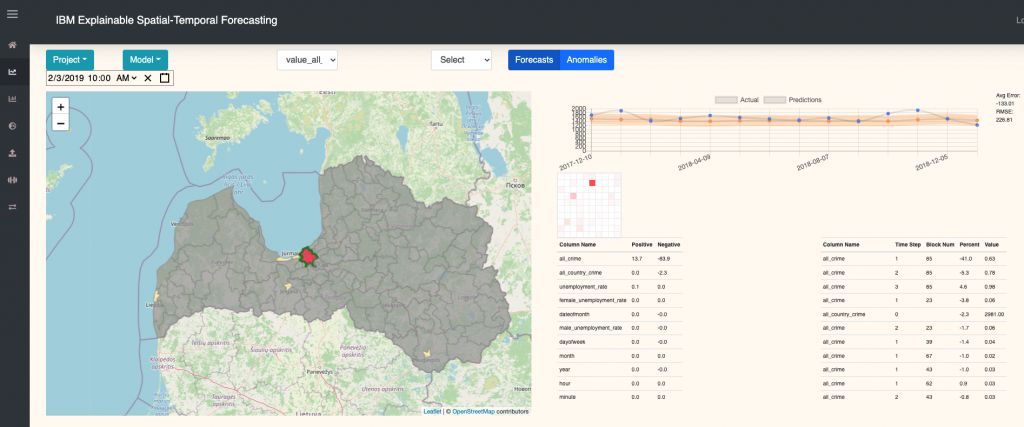
Screenshot of ESTF showing crime forecasts of Latvia with a forecast explanation of Riga
As an example, the anomaly detection is able to find abnormally high rates in some rural areas that are normally hidden by the known effect of factors present in highly densely populated areas.
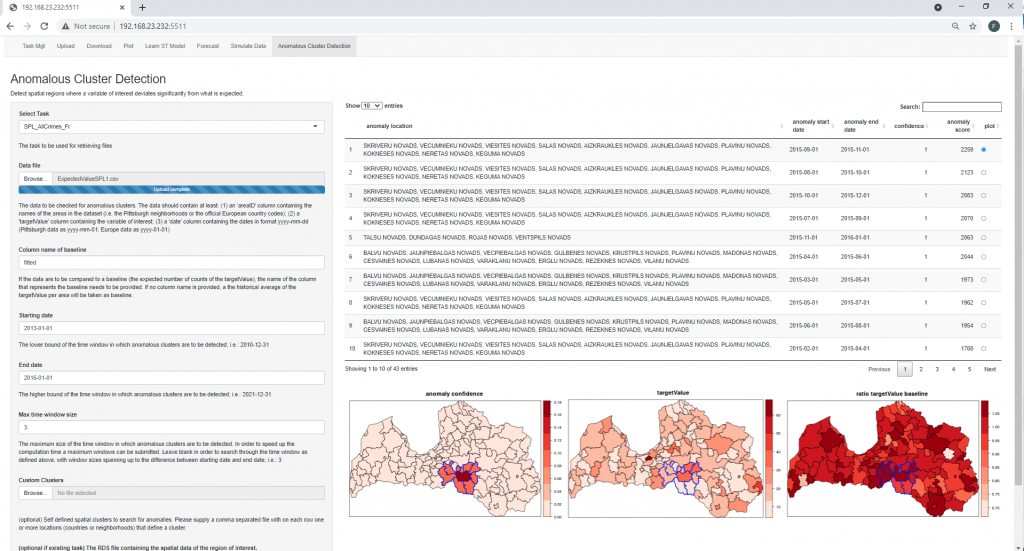
Screenshot presenting an example of anomaly in southern Latvia
For more information and updates follow us on Twitter, LinkedIn and Facebook and feel free to contact our team at copkit@copkit.eu.